This morning we are having a bit of a maths focus outside. You will need: a piece of paper, a pen and something to lean on, for you activity in the garden or your daily walk. After this, you will need graph paper (ideally, but plain paper will do), colouring pens or pencils, a writing pencil and a ruler.
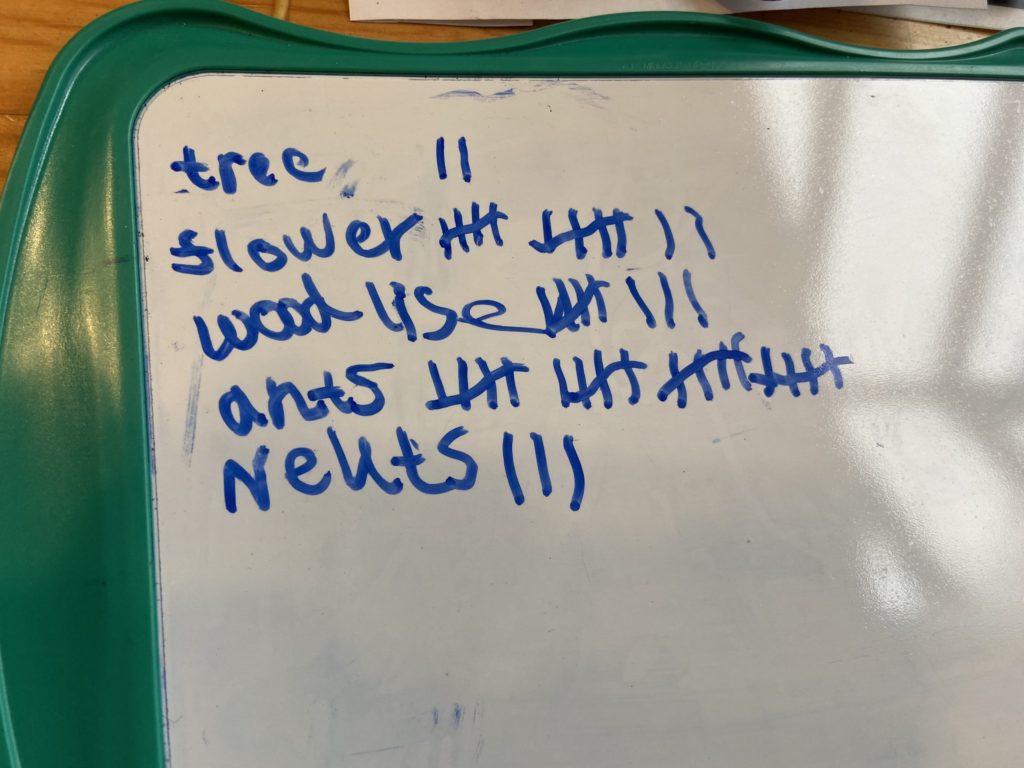
To start with you are going to do a survey. To do this, you write down your find, and then put a line next to it for each one. When you have completed a block of 4, the 5th line will go across the group (showing the group of 5).
You will need to explain how a tally chat will work and help at the beginning but older children should be able to manage this themselves. The children will probably see loads and want to include them all - thats ok, you might want to end the activity there but if you chose to carry on select 5 or 6 items to include in a bar graph later.
To complete a bar graph. Using the paper draw an axis. The horizontal axis (x) will be the items you spotted and the vertical axis (y) will be the number of the items you spotted. If you have graph paper, it's easy to write the numbers along the vertical axis, if you are using plain paper you will need to measure using the ruler and write a number up each centimetre (start at 0 on the bottom). For younger children parents might want to draw the axis first.
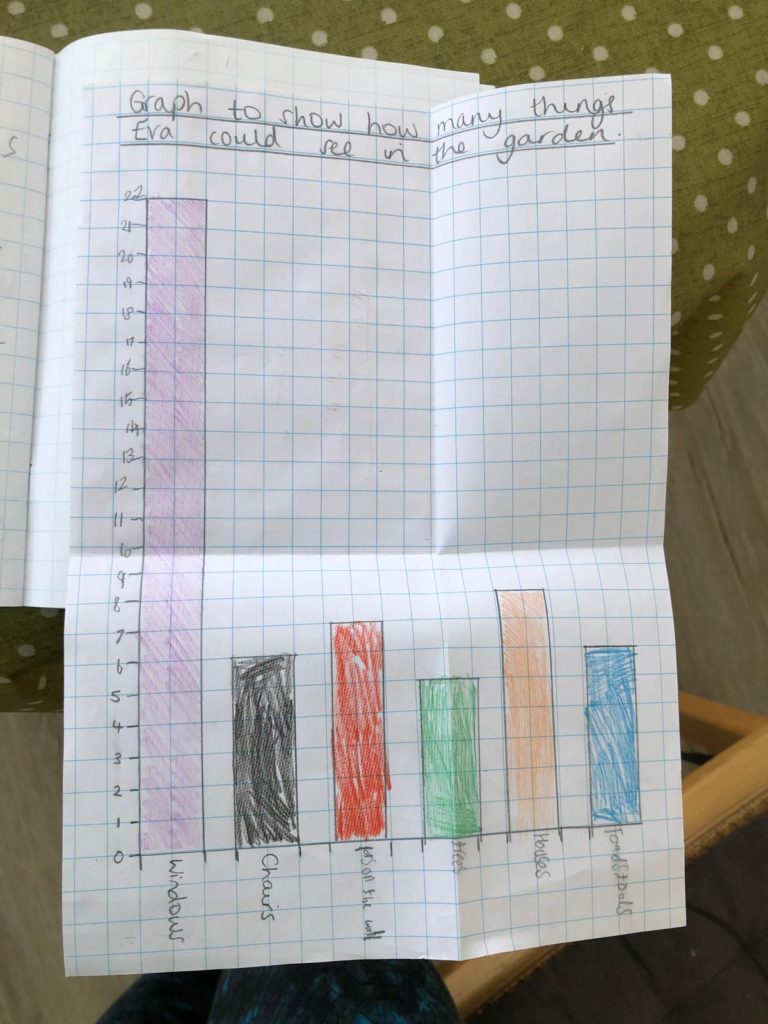
Now you draw a line for each bar on the graph to show the number of items you spotted, and you can colour them in different colours to make it easier to see. Some great maths for a nice outdoor activity!
Keep hold of it, because we will do another one mid summer!


[…] each find. If you want to extend this activity once you are home, you could use it to the complete the tally and bar chart activity we completed a few days […]
[…] You might want to see how many you can find and then do a tally chart and (KS1) a bar chart or (KS2) a scatter chart. Some guides here. […]